Shunlongwei Co. ltd.
IGBT Module / LCD Display Distributor
Customer Service
+86-755-8273 2562
IGBT Module / LCD Display Distributor
Time domain analysis (TDA) is a common method used by TDR time domain reflectometer oscilloscope to evaluate transmission lines. At the same time, the TDR measurement based on vector network analyzer (VNA), as an alternative to time domain analysis, has attracted more and more attention.
The E5071C option TDR provides a comprehensive solution on the same platform for VNA-based TDR time-domain reflectometer measurement, and provides unique functions that are not available in traditional TDR oscilloscopes. The purpose of this application note is to compare the data measured with the E5071C ENA vector network analyzer and the 86100D Infiniium DCA-X wide-bandwidth oscilloscope mainframe to verify the use of the E5071C option TDR time domain reflectometer.
Basic elements of TDR time domain reflectometer oscilloscope and VNA vector network analyzer
The TDR time domain reflectometer oscilloscope has historically been used for time domain analysis. It initiates a fast edge to the device under test (DIJT) and directly samples the voltage to recombine the waveform in the time domain. Although the method of this echo technique is straightforward, the measurement accuracy is low.
The VNA vector network analyzer is usually used for network characterization. It emits a sine wave and measures the vector ratio of the incident voltage and the reflected voltage at the same time. The frequency of the sine wave is swept to obtain the DUT’s response to the frequency function. As compared with TDR oscilloscopes, VNA vector network analyzers have a wider dynamic range, so it can perform more accurate measurements. In the TDR measurement based on the VNA vector network analyzer, the measured frequency response is converted into a time response by calculating the inverse fast Fourier transform.
Measurement data and comparison
We compared the TDR/TDT measurement and eye diagram empirical data extracted from the E5071C ENA vector network analyzer and the 86100D Infiniium DCA-X wide bandwidth oscilloscope mainframe.
A. TDR time domain reflectometer and TDT measurement
As shown in Figure 1, the board-level differential tracking measurement was performed on each test device using the same DUT. Before the measurement, a complete 4-port calibration was performed on the E5071C ENA vector network analyzer, and a TDR/TDT calibration was performed on the mainframe of the 86100D Infiniium DCA-X wide bandwidth oscilloscope. The measurement data of the two instruments is shown in Figure 2. The TDR and TDT waveforms are displayed in terms of impedance and voltage, respectively. In this comparison, the waveform formed by the 86100D Infiniium DCA-X wide-bandwidth oscilloscope host takes the average of 16 times to stabilize the measured value. The results show that these two methods are completely comparable. For example, in the TDR waveform, the amplitude difference remains within 0.4 ohms in the range of 0.7 to 1.0 nanoseconds. In the TDT waveform, the amplitude difference remains within 3 millivolts in the nanosecond range of 2.0-3.0°C.
Figure 1. The measured DIJT
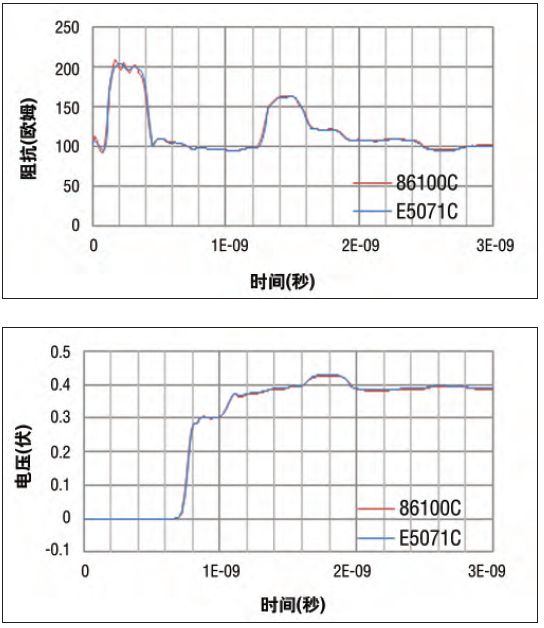
Figure 2. TDR waveform (top) and TDT waveform (bottom) formed by 86100D Infiniium DCA-X wide bandwidth oscilloscope and E5071C ENA vector network analyzer
1. In order to eliminate the timing offset caused by the difference in the calibration method, the TDR and TDT waveforms of the E5071C have been shifted by +20 psec and -70 psec, respectively.
B. Eye diagram
Keysight N4903B is a standard bit error rate tester, which is used with 86100D DCA-X wide bandwidth oscilloscope to draw eye diagrams. At the same time, the E5071C option TDR time domain reflectometer draws simulated eye diagrams based on the internally generated bit stream. Use cables of equal length in the two measurement systems and cannot compensate for the insertion loss of the cable (there is no way to compensate for the insertion loss of the cable). Figure 3 shows the eye diagram drawn by the 86100D DCA-X wide bandwidth oscilloscope and the E5071C option TDR. They are very similar in shape.
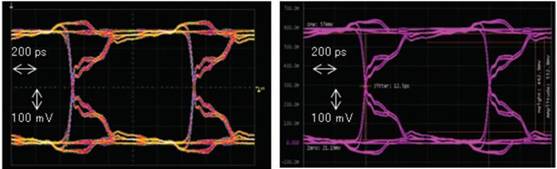
Figure 3. Eye diagrams extracted from 86100D wide bandwidth oscilloscope (left) and E5071C (right)
summary
In this article, we introduced the time domain analysis using the E5071C option TDR and compared the results with those of a standard 86100D DCA-X wide bandwidth oscilloscope. The TDR/TDT waveforms and eye diagrams extracted from each instrument are completely comparable. It ensures the reliability of the E5071C option TDR in time domain analysis.
Appendix: Test Procedure
equipment
A Keysight E5071C with TDR option a 4K5 vector network analyzer
One Keysight 86100D DCA-X wide bandwidth oscilloscope
One left module: 54754A differential and single-ended TDR/TDT module
One right module: 86112A dual-channel electrical module
A Keysight N4903B J-BERT bit error rate tester
E5071C option TDR
A. TDR/TDT measurement
1. Connect 3.5mm SMA cables to all test ports.
2. Open the Setup menu and click the Default Setup button.
3. Use the setting wizard to set the measurement conditions.
Open the Setup menu and click the Setup Wizard button.
Overview: Check the Use ECal module checkbox.
Step 1/5: Select the differential DUT dual port button.
Step 2/5: Connect the ECaI module to the cable, and then click the calibration button.
Step 3/5: Since the clamp is not used, skip this step.
Step 4/5: Connect the DUT, and then click the measurement button.
Step 5/5: Set the rise time to “35ps”, and then select “10-90%” from the drop-down list of “Sharpness”
4. Click Trace and select “3” to activate trace 3.
5. Open the TDR/TDT menu and select “Volt” from the drop-down list of “Format”. Trace 1 shows the TDR measurement in terms of impedance.Trace 3 shows the TDT measurement in terms of voltage
B.Simulated eye diagram
1. Use the setting wizard to set the measurement conditions.
Open the Setup menu and click the Setup Wizard button.
An overview: Uncheck the UseECal module checkbox.
One step 1/4: Select the differential DUT dual port button
One step 2/4: Disconnect DIJT, and click the skew elimination button.
Step 3/4: Connect DUT, click the measurement button.
Step 4/4: Set the rise time to “22ps”, and select “10-90%” from the drop-down list of resolution.
2. Click Trace, then select “5” to activate trace 5.
3. Open the Eye/Mask menu and set the bit pattern.
Type=PRBS length (bits): 2^7 – 1
Amplitude=200mV Data rate: 1Gb/s
4. Click Draw Eye.
For a more rigorous comparison, the rising step should be adjusted based on the observed value. Please refer to “Step Adjustment” in the appendix
86100D and N4903B
A. TDR/TDT measurement
86100D Infiniium DCA-X Wide Bandwidth Oscilloscope
1.Press on the front panel[Default Setup]Hard keys.
2.Calibration module[1][2].
Once you open the Calibrate menu, then click AII Calibrate to open all calibration dialog boxes.
1. Use the module calibration wizard to perform calibration on the left and right Modules.
3.Press down[TDR/TDT mode]Hard key to enter TDR/TDT mode.
4. Set the measurement conditions.
Click the TDRSetupE button under the setting tab on the tool sample to open the TDR/TDT setting dialog box.
Once Stimulus Mode is set to “Differential”, click on the tab indicating 2-port balance.
A pair of two modules for skew elimination2.
1. Use the wizard to perform TDR/TDT calibration[2].
1. Set Effective Rise Time to “35ps”.
1. Check the “Dlff TDR” and “Diff TDT” checkboxes on the Measurement Results panel.
1. Close the TDR/TDT Setup dialog box.
5. Change the measurement unit of the TDR waveform.
One click the button for the vertical scale of channel 1.
Click the Advanced button to set the unit to “Ohm”.
B. Eye diagram
1. Input the trigger clock from N4903B to 86100D Infiniium DCA-X wide bandwidth oscilloscope.
2. Connect DTAT OUT and OUT on the front panel of the N4903B to channels 3 and 4 on the 86100D, respectively.
N4903B
3.Press on the front panel[Preset]Hard keys.
4. Click the SeIect Pattern button under the Select tab to open the Select Pattern dialog box.
Select “2^n一1 PRBS” and set the Pattern Size to “2^7一1”
5. Click the Bit Rate SetupE button under the PG Setup tab.
6. Enter “1 GHz” in the value and unit text boxes.
86100D
7. The module is calibrated in the same way as TDR/TDT measurement.
8.Press on the front panel[Source]Button to set the trigger source to “front panel”
9. Open the setup menu, and then click Trigger to open the trigger dialog box.
1. Set Trigger Bandwidth to standard (DC-3.2 GHz).
10. Open the Measure menu, and then click Math.. to open the math dialog box.
1. Set Operators to “Subtract”, select “Channel 3” and “Channel 4” for source 1 and 2 respectively
Select Function 1 Display On
11. Press on the front panel[Auto Scale]Hard keys.
Step-up adjustment
The TDT waveform should be adjusted step-up.
E5071C option TDR
Click Trace and select “5” to activate trace 5.
2. Continuously click on MarderSearch and RiseTime (10-90%), the measured value will appear in the upper left corner of the screen.
86100D Infiniium DCA-X wide bandwidth oscilloscope host
Open the Measurement menu, click TDR/TDT and Risetime continuously
2. Set Source to Response 3, click OK, and the measurement result will be displayed at the bottom of the screen.
Fine-tune the rise time so that the observations are equivalent on the two instruments.