Shunlongwei Co. ltd.
IGBT Module / LCD Display Distributor
Customer Service
+86-755-8273 2562
IGBT Module / LCD Display Distributor
In addition to the basic function of collecting signals, the oscilloscope can also perform FFT transformation on the signal to obtain the frequency spectrum, which has the function of spectrum analysis. Almost all mid- to high-end oscilloscopes support FFT spectrum analysis. The spectrum analysis function that this article will introduce, Spectrum View, is a powerful spectrum analysis tool. Its introduction opens up a new time-frequency domain signal analysis.
Combining the TEK049 ASIC innovation platform and the spectrum mode of the TEK061 low-noise front-end amplifier chip – Spectrum View is a strong guarantee for high dynamics and low noise floor.

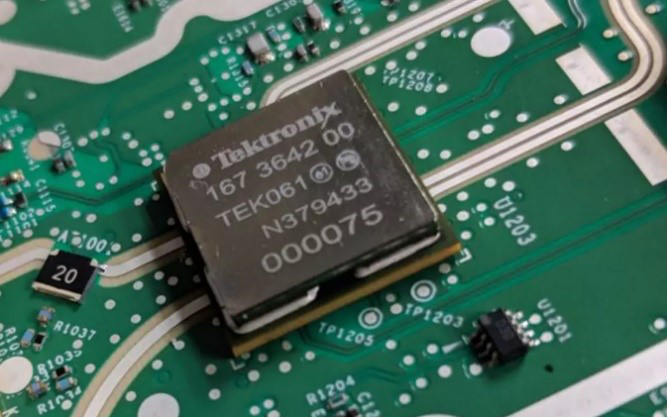
Figure 1. TEK049 platform and ultra-low noise front end TEK061
Spectrum View Features at a Glance
In terms of implementation method, Spectrum View also uses FFT, but it does not directly process the collected samples, but first obtains IQ data through digital down-conversion (DDC technology), and then obtains the signal spectrum through FFT. This is also a major feature compared to traditional FFT. Compared with the original acquisition signal, the frequency carried by the IQ signal is much lower, and the resampling of the IQ data does not require a high sampling rate, which greatly reduces the amount of data and improves the processing speed.
Whether compared with a spectrum analyzer or with the traditional FFT method of an oscilloscope, Spectrum View has its own characteristics:
・ Spectrum View makes the time and frequency domain capture time independent of each other, and can still ensure the processing speed of the oscilloscope when setting a smaller RBW. The traditional FFT test needs to change the RBW by adjusting the horizontal time base. In the test scenario that requires a small RBW, the horizontal time base needs to be increased, which seriously affects the processing speed of the oscilloscope.
・ Spectrum View has the operation settings of a standard spectrum analyzer, as shown in Figure 2, with a more friendly interactive interface, which can directly set the center frequency, Span, RBW and the type of the time domain window.
・ Spectrum View supports a variety of detection methods, and can test the spectrum of extremely low frequency signals, which is beyond the reach of ordinary spectrum analyzers;
・ Support multi-channel time and frequency domain joint analysis, and support trigger capture, so that it can analyze the spectrum of transient or intermittent signals;
・ Support multiple time window types, which can be selected according to the characteristics of the signal to be tested to ensure the accuracy of the test results;
・ Support peak automatic search function, you can set the peak search threshold, and can Display up to 11 Peak Markers;
・ Supports four trace display modes including Normal, Max. Hold, Min. Hold and Average;
・ When displaying the spectrum of multiple channels, it can be displayed either “Stacked” or “Overlay”;
・ All channels have the same Span, RBW, FFT Window and Spectrum Time, but the center frequency can be set independently.
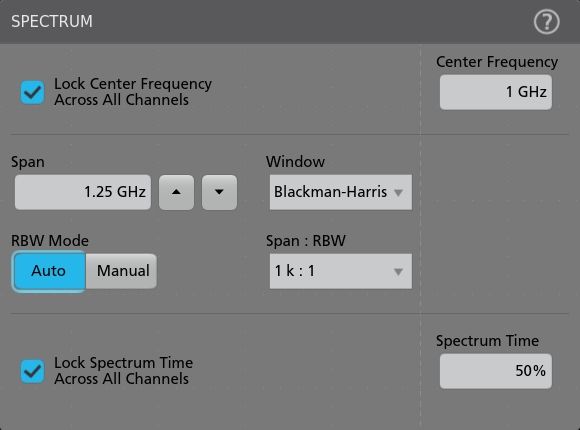
Figure 2. Spectrum View operation interface
Parallel analysis in time-frequency domain
Figure 3 shows the schematic diagram of the signal acquisition and processing architecture. After the analog signal is converted into a digital signal by the ADC, the time domain and frequency domain are processed in parallel, so that the time domain and frequency domain capture time can be set independently. Spectrum View supports sliding the position of Spectrum Time to perform spectrum tests on signals in different time periods, which makes it possible to perform time-frequency domain linkage tests on signals.
As an example, Figure 4 shows the analysis results of a frequency hopping signal, along with the results of the time domain waveform, spectrum, and frequency hopping sequence. The red mark in the figure is Spectrum Time, which is the time used for FFT analysis. Its position can be moved, and the tested spectrum is the spectrum corresponding to the current position. Drag the position of Spectrum Time to observe different frequency points respectively. The current observation is the spectrum change during frequency switching.
Multi-Channel Spectrum Testing
In the process of spectrum application, the data processing process of Spectrum View is the same as that of the spectrum analyzer in FFT mode. Although the test dynamic is not as good as that of the spectrum analyzer, Spectrum View has its own advantages. For example, it can test extremely low frequency signals, and has rich and flexible detection methods. And the correlation of time-frequency analysis. In addition, Spectrum View also supports multi-channel spectrum testing, thanks to the TEK049’s support for simultaneous spectrum analysis and processing of each channel’s signal.
Similar to the multi-channel time-domain waveform display method of TEK049, the activated spectrum can be displayed either “Stacked” or “Overlay”. Figure 5 observes the time-domain waveform and spectrum of the two channels at the same time, and uses overlapping display to facilitate the comparison between the spectrums.
The spectrums of all channels share the same Span, RBW, FFT Window and Spectrum Time, which is similar to the time domain requirement of sharing sampling rate, horizontal time base and triggering among multiple channels. Nonetheless, the center frequency of each channel can be set independently, linked by default, or can be set to different values as needed.
Spectrum View supports automatic peak search and supports up to 11 Peak Markers. The frequency point with the largest amplitude is automatically marked as “Ref. Marker”. The frequency points and amplitudes of other Markers can be displayed as absolute values or relative to Ref. Marker” relative value. If the number of markers required exceeds the limit, the frequency and amplitude can also be determined by using the cursor in the frequency domain.
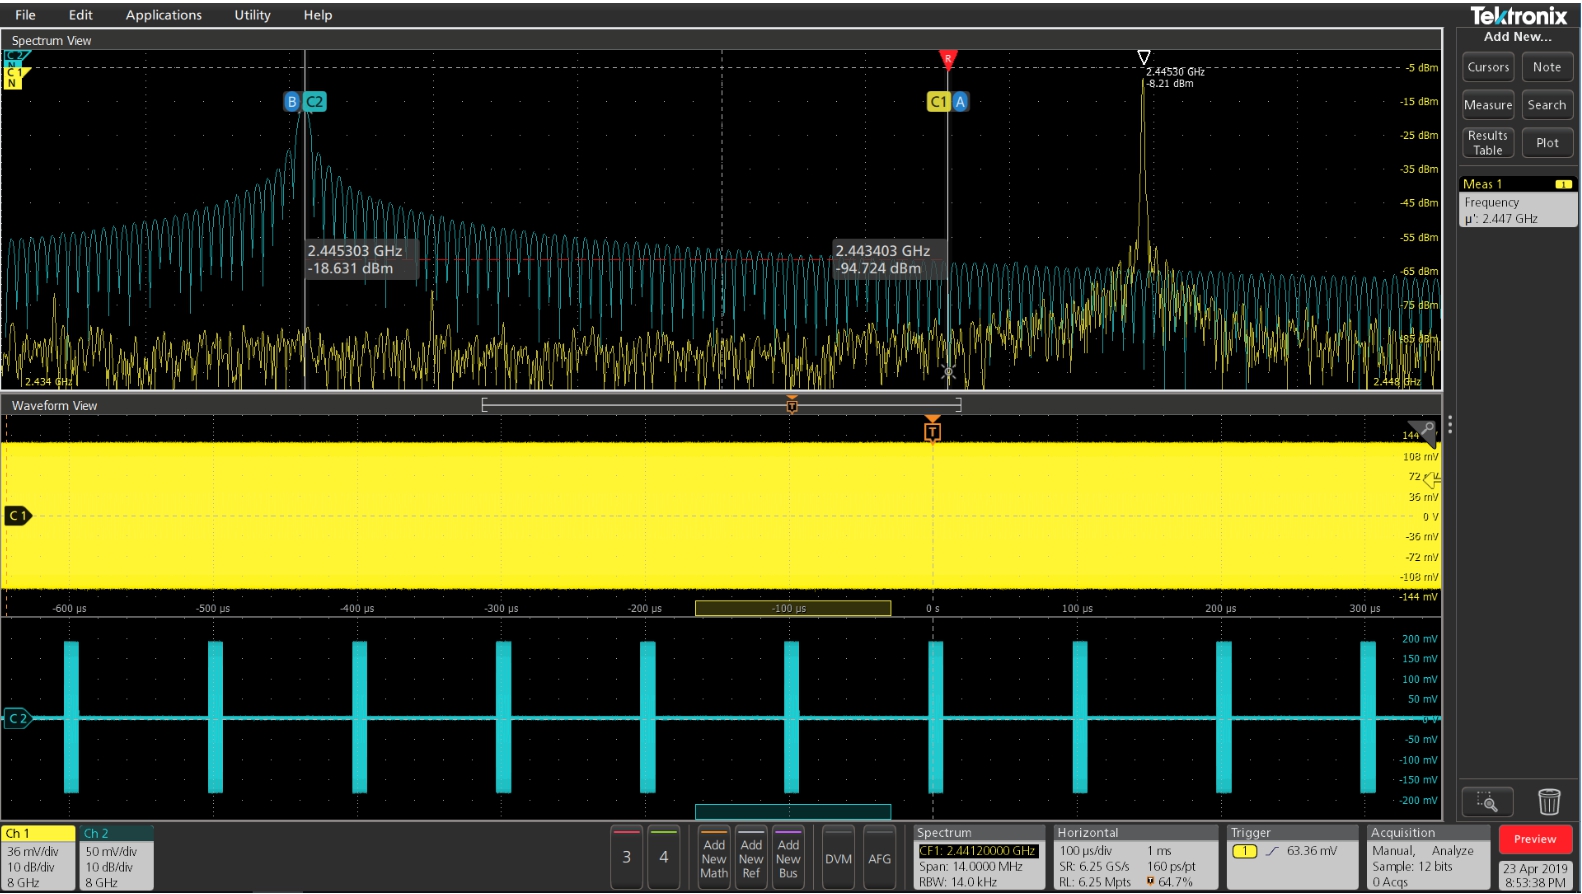
Figure 5. Simultaneous observation of time-domain waveforms and spectra of two channels
summary
In this paper, the Spectrum View function is introduced, and the differences and advantages compared with the traditional oscilloscope FFT method are described. The introduction of the Tek049 platform and the low-noise amplification front-end Tek061 enables the oscilloscope to achieve a low noise level, which is an important prerequisite for testing the spectrum of weak signals. The parallel processing architecture of the time domain and the frequency domain makes the data capture in the time and frequency domains independent of each other, and the mobility of the Spectrum Time enables the oscilloscope to have a multi-domain linkage analysis function.