


Content last revised on September 29, 2026
Full Screen Primary Color AOI Screening: Stuck Sub Pixels and Background Uniformity Audit
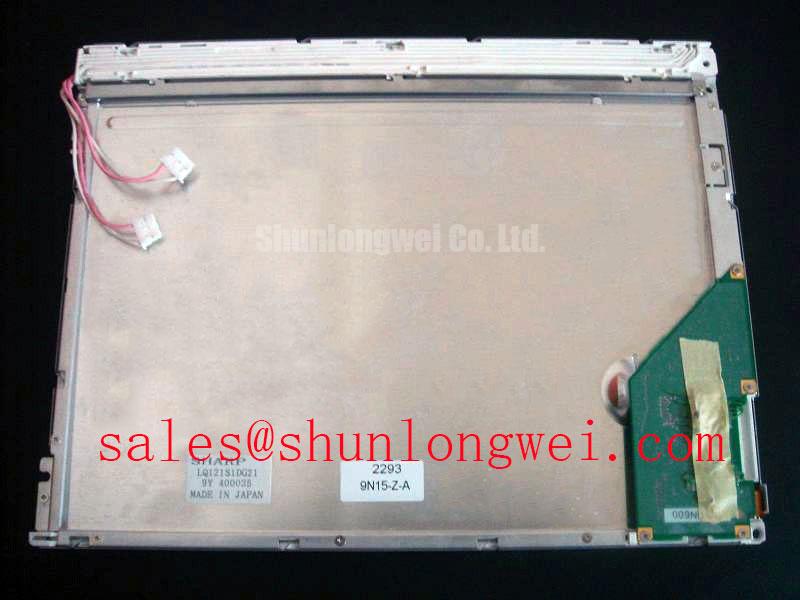
Display a full red, green, blue, white, and black test sequence while observing the complete active area for stuck sub pixels, dark columns, bright points, uneven luminance, and intermittent line defects. Record each defect by its position and behavior rather than assigning a single cause from visual appearance alone. The Sharp LQ121S1DG21 is identified as a TFT LCD active matrix color display module, so the inspection should cover both pixel addressing behavior and the optical field produced by the complete display assembly.
Use a controlled bench sequence with the panel connected to a known good controller and the intended signal format. A full red field helps expose sub pixel nonuniformity, a green field often makes column or row abnormalities easier to locate, and a blue field can reveal defects that are less visible against neutral backgrounds. White and black fields provide a useful comparison for luminance uniformity, edge shading, and dark-field contamination. Capture the result at consistent viewing distance and ambient lighting so that the same panel can be compared after mechanical installation.
A flashlight test at approximately 45 degrees can help separate an optical illumination problem from an addressing defect. With the panel displaying a black field, move the light source across the front surface and inspect whether a suspected dark area changes in apparent contrast. A response that follows the external illumination may point toward surface reflection, cover interaction, or backlight distribution. A fixed line or isolated point that remains in the same pixel coordinates requires signal-path and panel-driver investigation. This method is a screening aid, not proof of a specific internal failure mechanism.
For outdoor or bridge-console evaluations, direct sunlight can conceal low-contrast defects and make reflections appear similar to luminance nonuniformity. The supplied factory information does not establish a model-specific optical contrast value under 50,000 lux, nor does it confirm a particular anti-glare coating specification. Designers should therefore measure the installed assembly under the actual window, hood, cover, and illumination conditions. The Sharp Devices Europe Industrial Display Solutions resource provides useful manufacturer-level context for industrial display evaluation, while general TFT operating principles are described in the TFT LCD technology reference.
When a line defect appears, compare the panel with a known good controller, inspect the connector seating, and verify the clock and data waveforms at the panel interface. A change in defect position after cable movement may indicate a connection or mechanical stress issue, while a stable defect under identical electrical conditions may require panel replacement assessment. Do not classify a display as acceptable from a single white image; color-field testing is necessary because different sub pixels and drive conditions can reveal different anomalies.
Wide Temperature Operational Margin and Sub Zero Liquid Crystal Response
Place the display in a controlled thermal test environment and observe the first image after temperature stabilization, gray transitions, black uniformity, and recovery during temperature movement. The supplied product data identifies the LQ121S1DG21 as an industrial TFT LCD module but does not provide a verified operating range of −30°C to +85°C. That range must not be treated as a factory rating for this model unless it is confirmed by the original Sharp documentation for the exact revision.
At low temperature, liquid crystal viscosity can increase and cause visible gray-to-gray response lag. The practical test is to display moving gray bars and alternating image patterns while monitoring whether trailing, smearing, or delayed transitions appear. Compare the result with room-temperature behavior using the same controller timing, image content, and backlight condition. A slower transition may be influenced by the panel temperature, controller drive configuration, signal timing, or the measurement method, so the observation should be logged together with the thermal state.
At elevated temperature, inspect image uniformity, edge behavior, connector retention, and any change in optical leakage. Thermal cycling should also include a visual check of the perimeter assembly and mounting interfaces. The internal sealant composition and construction of this display are not specified in the supplied factory information, so claims about sealant stability or internal material behavior should not be presented as model-specific facts. The correct engineering approach is to test the complete panel, bezel, cable, controller, and enclosure as one assembly.
For a harsh marine radar or navigation bridge console, salt-laden air, condensation, window heating, and enclosure temperature can create conditions that differ substantially from a laboratory bench. The display itself should not be used as evidence that the finished console has marine environmental qualification. Designers should verify enclosure sealing, condensation control, connector protection, and thermal airflow at system level. Electrical and optical measurements should be repeated after environmental exposure when the equipment design requires that validation.
Gray-to-gray performance also depends on the source controller and timing configuration. If the image becomes unstable during a temperature transition, inspect the panel supply behavior, reset sequence, clock continuity, data formatting, and controller gamma configuration before attributing the result to liquid crystal response. A known-good waveform capture at the same temperature is more useful than a visual comparison made with different timing settings.
Backlight Thermal Review and Optical Assembly Preservation
Measure the temperature distribution along the display edges and near the backlight interface while the panel operates at its intended brightness, then compare the thermal map with visible luminance uniformity. The supplied specification identifies an active matrix TFT color display module, but it does not confirm the backlight architecture, LED rail construction, light-guide material, L70 or B50 life data, or a model-specific brightness rating. Those characteristics must remain open until the exact factory documentation and assembly revision are verified.
When integrating the LQ121S1DG21, keep heat sources, switching regulators, and high-current return paths away from the display edge and backlight connection wherever the enclosure permits. A spreader or mechanical heat path may be considered when the measured assembly temperature shows localized heating, but its size, material, and attachment method are system design decisions. The purpose is to reduce thermal concentration without transferring chassis stress into the panel frame or optical stack.
Do not assume that an edge-bright or edge-dark region is caused by the display module alone. Inspect the bezel opening, diffuser position, pressure points, cable routing, and controller brightness setting. Optical nonuniformity can change when the panel is clamped, when the cover window is installed, or when the backlight current changes. A before-and-after comparison on a free-standing panel and in the final chassis can identify whether the enclosure is contributing to the observed result.
High-frequency factory equipment can also disturb the display link. Keep the differential pair route continuous, minimize unnecessary stubs, and control the return path through the connector and cable transition. A nominal differential impedance target such as 100 ohms may be used only when it matches the controller, cable, and panel interface requirements; it is not a confirmed LQ121S1DG21 factory parameter. The system engineer should verify signal integrity with the actual cable length, connector, clock rate, data format, and enclosure environment.
JEIDA and VESA pixel mapping should be confirmed from the original panel documentation and controller configuration rather than inferred from connector similarity. Incorrect bit ordering can produce abnormal color balance even when the image appears stable. Gamma and gray-level voltage behavior belongs to the T-CON and controller integration, so a color or contrast complaint should be checked against source data, timing, gamma settings, and supply quality before the panel is rejected.
The LQ104V1DG5B comparison provides a useful reference for evaluating a related display solution and its surrounding system topology. It should not be treated as proof of pin, timing, optical, or backlight compatibility with the LQ121S1DG21. Every replacement or companion display requires connector, mechanical, timing, and environmental verification.
Chassis Fastener Loading and Optical Mura Control
Loosen the display from the chassis and compare a free-standing image with the same image after installation to determine whether dark regions, bright bands, or corner shading change with mechanical loading. This simple comparison can expose enclosure-induced optical distortion without assigning the defect to the LCD cell or backlight prematurely.
The supplied factory data does not establish an M3 fastener torque specification, bezel envelope tolerance, or approved compression limit for the LQ121S1DG21. A value such as 0.35 to 0.45 N·m must therefore be treated as a general design consideration, not as an official Sharp requirement. The correct fastening method depends on the frame material, insert strength, gasket behavior, panel support points, screw length, and the mechanical drawing for the exact assembly.
Use a cross-pattern fastening sequence with gradual, even loading when the mechanical drawing permits it. Check the panel image after each installation stage, especially on black, white, and primary-color fields. If a mura region changes when a fastener is relaxed, inspect contact surfaces, bezel flatness, spacer placement, cable routing, and local frame distortion. The result may indicate mechanical stress, optical stack movement, or illumination nonuniformity, and further inspection should distinguish among these possibilities.
Keep the chassis opening aligned with the visible active area and avoid allowing the outer bezel to carry unintended point loads. The enclosure must also provide clearance for the connector and cable bend without pressing the rear of the module. For a marine radar or navigation bridge console, the window, gasket, sealing frame, and anti-reflection treatment should be assessed together because each can alter viewing contrast, glare, and local pressure.
Pro Tip: Disconnect power before inserting or removing the display cable, and verify the connector orientation before reassembly.
For a same-size or similar-resolution replacement study, engineers can review LQ104S1LG61 as a separate candidate, then compare its mechanical drawing, electrical interface, timing, optical characteristics, and environmental ratings against the host equipment. Similar dimensions alone do not establish interchangeability.
Use the Industrial Display and HMI Solutions engineering guide when reviewing enclosure integration and harsh-environment design factors. The final acceptance test should include the installed image, connector retention, power sequencing, signal integrity, thermal behavior, and mechanical loading under the operating conditions defined for the equipment.